
The spread is real. The slide skips three questions. What exactly are you forecasting? When must you know it? How much can you trade before you become the price? One Thursday in Finland, 5 November 2026, at trade-by-trade resolution, shows why each is hard.
A day where the spread looked free
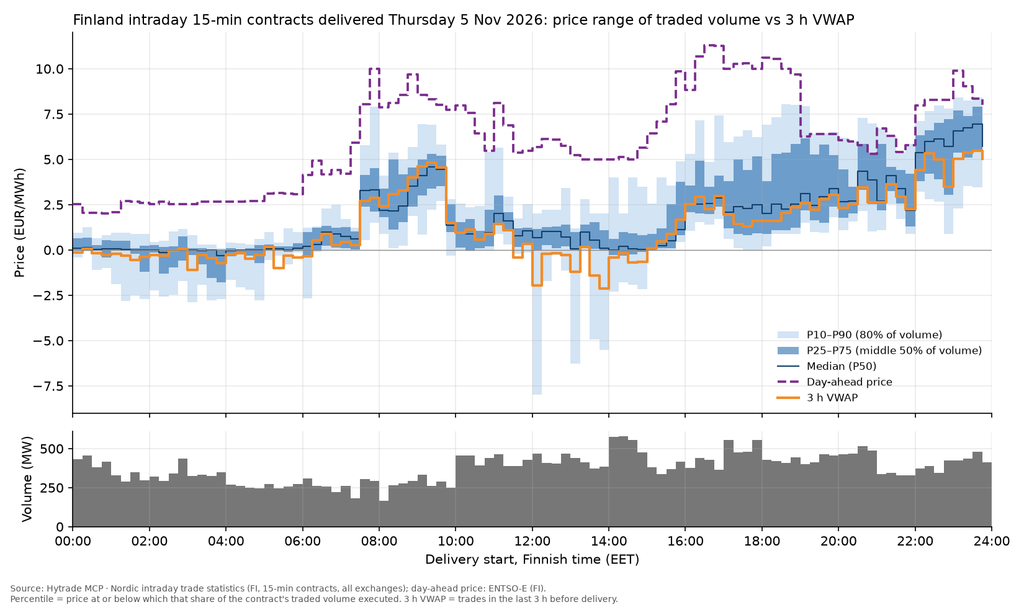
Figure 1. Every Finnish 15-minute intraday contract delivered on 5 November 2026. Bands show the price range of traded volume; orange is the VWAP of the last three hours before delivery; purple dashed is day-ahead.
On 5 November, intraday traded below day-ahead in all 96 quarters. The last-three-hours VWAP sat 3–8 EUR/MWh under day-ahead most of the day. At midday it went negative while day-ahead held at 5–6.
The market went into delivery longer than the day-ahead auction had assumed. That is consistent with more wind or less load than day-ahead bids priced in. Short day-ahead, buy back intraday: a winner in all 96 quarters.
But within one quarter, 80% of volume spans 3–10 EUR/MWh, the same order as the spread. There is no single intraday price, only a distribution that drifted lower into delivery. And at 19:00 day-ahead steps from 10 to 6 while intraday barely moves. Part of the spread lives in the day-ahead curve, not in intraday.
One quarter, 592 trades
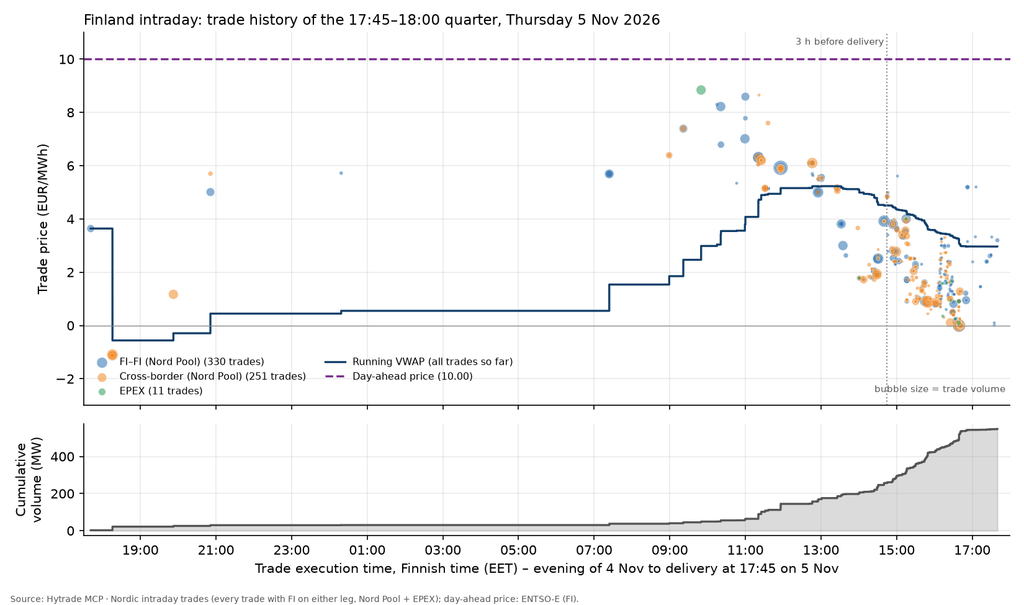
Figure 2. All 592 trades in the 17:45–18:00 quarter, from the evening of 4 November to delivery. Bubble size is trade volume; the lower panel is cumulative volume.
The 17:45–18:00 quarter cleared day-ahead at 10.00 EUR/MWh and printed 592 intraday trades across Nord Pool and EPEX. By 11:00 on delivery day only a tenth of the final 550 MW had traded. More than half came in the last three hours.
Late morning, trades printed at 5–9 EUR/MWh. From 13:00 the price broke. The contract closed near 3.0 VWAP overall and 1.6 for the last three hours.
Cross-border trades thin out about an hour before delivery, in line with cross-zonal gate closure. The final hour is domestic liquidity only, exactly when an open position is most urgent to close. Buy back at 11:00 and you locked in 2–3 EUR/MWh; at 16:00, 8–9. Timing was worth more than the average spread.
The same spread is why backtests flatter. Assume the session VWAP or the last-three-hours price as the buy-back and this quarter shows 7–8.4 EUR/MWh. Trade it late morning and you got 2–4. Add full fills at any size and no imbalance cost, and a strategy wins on paper and loses live.
What you actually have to forecast
Day-ahead bids close at 13:00 Finnish time the day before, almost 29 hours before the 17:45 quarter. You bid a curve without knowing the clearing price. Everything you forecast must be known then.
- The spread, not the intraday price, conditional on each possible day-ahead outcome. The two forecast errors are correlated. Two good standalone forecasts do not make a good spread forecast.
- The news after gate closure. The spread is the market repricing wind, load, outages and capacity updates. If day-ahead is efficient, the expected spread is near zero. An edge needs a specific source.
- The price path. Your fill depends on when you trade and when depth arrives.
- Your own impact. At size, you are forecasting someone else's price.
- The tail. Unclosed volume settles at imbalance. That is a bet, not arbitrage.
Timing and liquidity set the size of the edge
Liquidity arrives late. Early prices look attractive but carry few megawatts. Late depth comes after the price has moved, with everyone sharing your view trading the same way. On 5 November, every megawatt bought back by day-ahead shorts supported the price they were paying.
A Finnish quarter traded 250–580 MW that day. A 20 MW position is 4–8% of the full session and far more of the late window where it must execute, across 96 books a day. The midday tails down to −8 EUR/MWh were someone dumping into a thin book. Catching them takes resting orders, not a forecast. Execution policy is part of the alpha: the forecast and the execution are one model.
What good looks like
Ask for four things from anyone claiming this edge. A spread forecast made at day-ahead gate closure and conditional on the day-ahead outcome. Execution simulated against trade-level data, not settlement prices. P&L reported at realistic size. And an explicit view of what happens to volume that is not closed.
That is why we work at trade resolution. Both charts here come from Hytrade's own data pipeline: every intraday trade with Finland on either leg, across Nord Pool and EPEX, joined to day-ahead prices quarter by quarter. Intraday arbitrage is not a forecast. It is a forecast, an execution policy and a risk limit, built as one.